धान फसल में नाइट्रोजन उर्वरक प्रबंधन में लीफ कलर चार्ट की भूमिका
Paddy is the most staple and nutritive food crop for world human population and other animals.It requires nutrient elements for their establishment and survival. Among those nutrient elements, nitrogen (N) is the most important nutrient which is essential for photosynthesis and thereby increases the yield.
Unlike other crops, N can be managed effectively at real time all the stages of crop growth by using Leaf Colour Chart (LCC).
Even this technique is being in use for several years, most of the formers are not aware of this technique. But this is simple, inexpensive and easy technique to manage the N in paddy by formers without any others helps.
N management in paddy:
Application of N fertilizer to the crop is based on type of varieties, spacing, nitrogen requirement, number of splits of nitrogen doses, etc., Check the overflow of water or runoff immediate after the fertilizer application to check the nitrogen loss through runoff water. In the same time denitrification losses arealso be checked.
Large application of nitrogen should be avoided for low nitrogen response varieties such as white Ponni. If nitrogen deficiency is observed, 25% of recommended dose nitrogen fertilizer should be applied excessively to overcome the deficiency.
It means 125% of recommended dose nitrogen fertilizer should be applied in nitrogen deficient fields. Also foliar spray can be done by dissolving urea in the water at the rate of 10g urea in one litre of water.
Role of LCC in N management in paddy
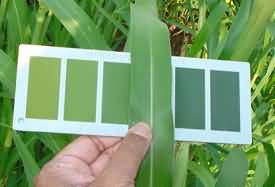
LCC is the chart which appears that of paddy leaves and having the colour from dark green to yellowish green colours.Yellowing of leaves in paddy indicates the deficiency of nitrogen, but it is difficult to decide the quantity of nitrogen to be applied based on the extent of yellowing.
The concentration green or yellowish green colours of LCC reflect the N concentration (deficient or sufficient) of paddy leaves. Dark green colour of a leaf represents the abundant nitrogen status of that leaf and increases in yellow colour shows the severenessindeficiency of that leaf.
The leaf colour chart consists of 4 or 6 green strips, 1st strip with light green colour and the last strip (4th or 6th) with dark green colour and in between strips (2nd to 5th) is with varying intensity of green colour.
Assessment of LCC critical value by using of Leaf Colour Chart
- Select fully opened disease free new leaf i.e. third leaf from the top as index leaf in paddy plant for assessing the leaf colour and ten leaves to be selected from ten plants in the field.
- Match the colour of the selected leaves by keeping the middle of the leaves on the colour strips of leaf colour chart and assess the colour intensity ( LCC value) during morning hours (8-10 am).
- Assess the intensity of leaf colour each time at a particular time by a particular individual.
- Take average of two if the leaf colour matches between two colour strips of the chart.
- Commence the assessment of the leaf colour with LCC at 14 DAT (days after transplanting) in transplanted rice or 21 DAS (days after sowing) in direct seeded rice and continue up to flower initiation/heading at an interval of 7-10 days.
- Critical LCC value varies with the type of paddy genotypes. LCC critical value is 3.0 in low N response cultures. In Tamilnadu LCC critical value is 3.0 in low N response cultures like White Ponni and 4.0 in other cultivars and hybrids.
- Assess the average LCC values of 10 leaf samples. When the average LCC value of ten leaves or when the LCC values of five or more leaves found below the LCC critical value, then top dress nitrogen depending on the crop growth and stage.
Generally, application of N is recommended as follow as
| Sl. No. | Season & variety | LCCcritical value | N requirement (kg) | Urea requirement(kg) | |
| 1. | Wet season (Kharif) | Non-basmati | 4 | 28 | 61 |
| Basmati | 3 | 23 | 50 | ||
| 2. | Direct seeded* | 3 | 23 | 50 | |
| 3. | Boro rice* | 4 | 35 | 76 | |
* 23 kg of N should be applied as basel dose.
Benefits of LCC:
- N can be supplied as required by the crop at different stage
- Easy to handle by farmers and it is inexpensive
- N use efficiency can be enhanced
- 5 to 10 kg / acre of nitrogen can be saved
- 7 million ton of N is saved per year in India
Conclusion:
Since nitrogen is subjected to many losses from the rice field, it should be applied at required quantity and at required time to enhance the yield and minimize the losses.
It can be easily achieved by leaf colour chart. Technology should be developed to manufacture the LCC for different crops and for different nutrients.
Authors:
1Thamarai Thuvasan K*, 2A.Suganya, 3L.Jeevitha and 4SMR. Priyanka
1Assistant Professor, Department of Soil Science & Agricultural Chemistry, Vanavarayar Institute of Agriculture, Manakkadavu, Pollachi.
2Assistant Professor, Department of Soil Science & Agricultural Chemistry, ThanthaiRoever Institute of Agriculture and Rural Development, Elambalur, Perambalur.
3&4Final Year B.Sc. (Agri.), Vanavarayar Institute of Agriculture, Manakkadavu, Pollachi.
Corresponding author email: