फसल सुधार में बायोमेट्रिक्स की भूमिका
In the year 2010, the world’s population was estimated to be more than 6.8 billion people. The United Nations projects that the world population will surpass 7 billion in 2012 and reach 9 billion by 2050. Feeding those billions of additional people will be a major challenge for agriculture in next few decades. Crop plants will have to provide most of the calories and nutrients required for world’s future population.
The genetic analysis of complex characteristics such as the oil content of corn is known as quantitative genetics. Statistical analysis has many applications ensuring the validity and reproducibility of plant breeding and genetics research. We must use statistical procedures that have been developed for analyzing complex characteristics. “Biometrics is the science that deals with the applications of statistical procedures to the study of biological problems.” Similarly biometrical genetics, which attempts to unravel the inheritance of quantitative traits using statistical concepts and procedures it is also known as quantitative genetics for obvious reasons.
Crop plant germplasm collections are often too large to be of use regularly. A core subset with fewer accessions can increase utility while maintaining most of the genetic diversity of the complete collection. This study evaluated methods for selecting core subsets using sparse data. All the available data used to calculate statistical parameter like mean, variance, standard deviation, error, standard error etc. Evaluations of genotypes in varied environmental conditions are referred to as multiple environment trials (MET) and often necessitate estimation of effects of genotypes within environments.
Empirical best linear unbiased predictions can provide more accurate estimates of these effects, depending upon the mixed model used. Simulated MET were fit with mixed models with or without genetic relationship matrices and with structures of varying complexity used to model relationships among environments. The model that included a GRM and a constant variance-constant correlation structure was the most accurate for the largest number of scenarios.
More complex models were the most effective for a smaller subset of scenarios, most involving many genotypes and low experimental error. The present discussion is limited in scope to a brief description of some common biometrical techniques and their relevance to plant breeding.
Minor genes with small and cumulative effect, their expression is greatly affected by the environment govern quantitative traits and inheritance of these traits is called polygenic inheritance. Characters of polygenic traits are:
- Expression of polygenic traits is governed by several genes
- Variation is continuing from one extreme to another
- The effect of individual gene is small and undetectable by visual observation
- Polygenic characters are highly sensitive to environmental effect
- Analysis of polygenic characters is based on means, variance and covariance
- Grouping of polygenic characters in to clear cut classes is not possible due to continuous variation
Statistical and biometrical tools and technics:
Sampling:
The population is the group of individual; a sample is a subset of the population. The sample should be representative of the population and large enough to minimize chance differences between the population and the sample. The group of individuals called the population is too large for a complete census. One solution is to measure a smaller collection of individuals, called a sample and use measurements made on the sample to describe the population.
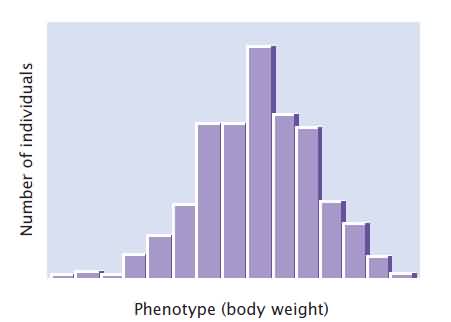
Frequency distribution:
Phenotypic variation in a group can be conveniently represented by a frequency distribution, which is a graph of the frequencies of the different phenotypes A frequency distribution is a concise method of summarizing all phenotypes of a quantitative characteristic.
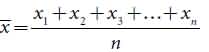
Mean:
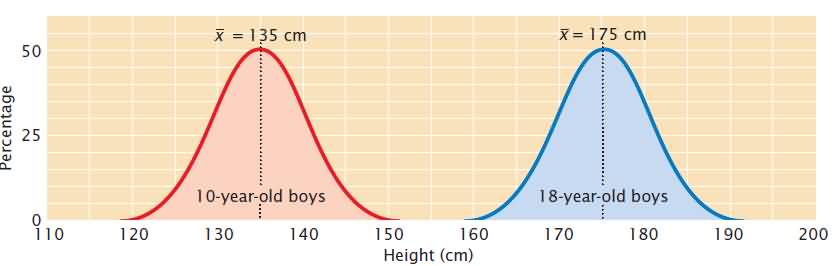
The mean, also called the average, provides information about the center of the distribution. If we measured the heights of 10-year-old and 18-year-old boys and plotted a frequency distribution for each group, we would find that both distributions are normal.
 OR
OR 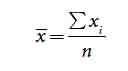
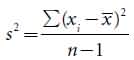
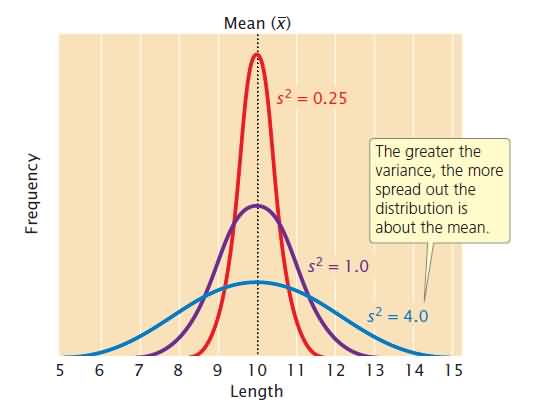
Variance and Standard Deviation:
A statistic that provides key information about a distribution is the variance, which indicates the variability of a group of measurements, or how spread out the distribution is. Distributions may have the same mean but different variances. Another statistic that is closely related to the variance is the standard deviation (s), which is defined as the square root of the variance. Whereas the variance is expressed in units squared, the standard deviation is in the same units as the original measurements; so, the standard deviation is often preferred for describing the variability of a measurement. The mean and variance describe a distribution of measurements the mean provides information about the location of the center of a distribution, and the variance provides information about its variability.

Correlation:
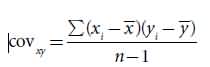
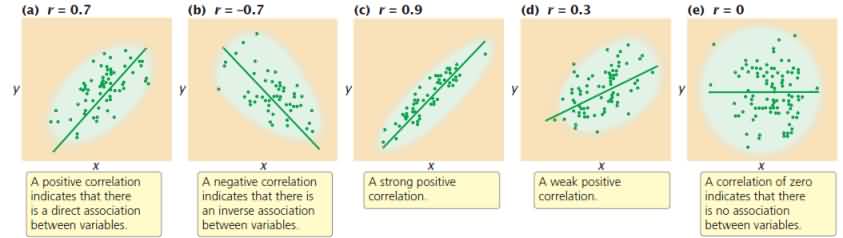
A correlation coefficient measures the strength of association between two variables. The sign positive or negative indicates the direction of the correlation; the absolute value measures the strength of the association. Correlations between characteristics are measured by a correlation coefficient designated by (r) which measures the strength of their association. A correlation coefficient can theoretically range from −1 to +1. A positive value indicates that there is a direct association between the variables as one variable increases; the other variable also tends to increase. The (r) is obtained by dividing the covariance of x and y by the product of the standard deviations of x and y:

Regression:
Regression is used to predict the value of one variable on the basis of the value of a correlated variable. A positive correlation exists between the body weight of parents and the body weight of their offspring; this correlation exists in part because genes influence body weight, of parents and children have genes in common. Because of this association between parental and offspring phenotypes, we can predict the weight of an individual on the basis of the weights of its parents. This type of statistical prediction is called regression. This technique plays an important role in quantitative genetics because it allows us to predict the characteristics of offspring from a given mating, even without knowledge of the genotypes that encode the characteristics. The regression line defines the relation between the x and y variables and can be represented by.


x and y represent the x and y variables (in this case, the father’s weight and the son’s weight, respectively). The variable a is the y intercept of the line, which is the expected value of y when x is 0. Variable b is the slope of the regression line, also called the regression coefficient.
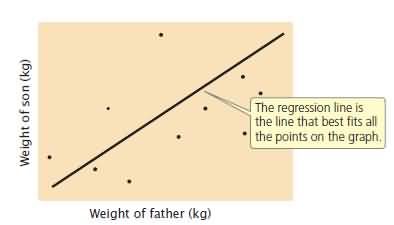
Illustrated here is a regression of the weights of fathers against the weights of sons. Each father–son pair is represented by a point on the graph: the x value of a point is the father’s weight and the y value of the point is the son’s weight.
Diallel cross:
A complete diallel mating design is one that allows the parents to be crossed in all possible combinations, including selfs and reciprocals.
Chi-square test:
The chi-square (χ2) test is used by plant breeders to test hypotheses related to categorical data such as would be collected from inheritance studies. The statistic measures the deviations of the observed frequencies of each class from that of expected frequencies. Its values can be zero or positive but not negative.
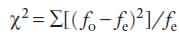
Where fo = observed sample frequency, and fe = expected frequency of the null hypothesis (H0), the hypothesis to be “disproved”.
Principal Components Analysis (PCA):
The primary purpose of PCA is to define the underlying structure in a data matrix. As data reduction or exploratory methods, these procedures are used to reduce the number of variables and to detect structure in the relationships between these variables.
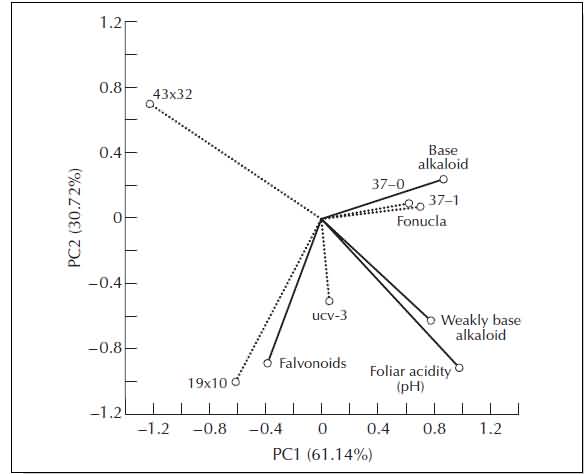
A graph based on PCA of five sesame genotypes as operational taxonomic units (dotted lines), and three secondary metabolites in leaves and foliar acidity as variables (solid lines).
Biplot technique:
Success in evaluating germplasm, breeding lines, and cultivars in multiple environments and for complex traits to identify superior genotypes with specific or wide adaptation can be achieved if the genotypic (G) and environmental (E) effects and their interaction (GE) are precisely estimated (Yan et al. 2000). The GE biplot procedure has been used by breeders and agronomists for dissecting GE interactions and is being used to analyze data from genotype × trait, genotype × marker, environment × QTL, and diallel cross data. The biplot allows a readily visualized display of similarity and differences among environments in their differentiation of the genotypes, the similarity and differences among the genotypes in their response to locations, and the nature and magnitude of the interaction between any genotype and any location.
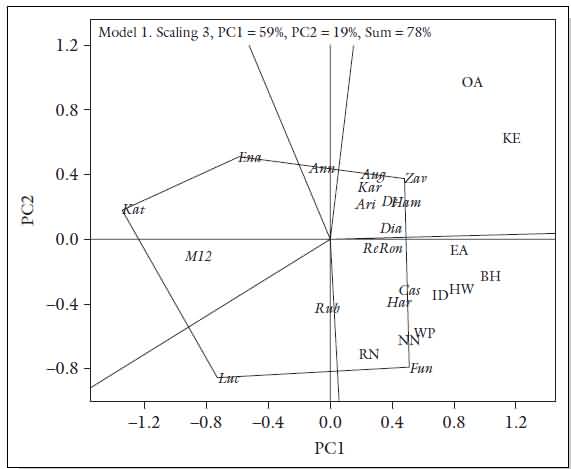
Biplot showing performance of different wheat cultivars (in italics) in different environments (in capital letters) as a selection method to identify superior cultivars for a target environment.
D2 Statistics:
The concept of D2 statistics was originally developed by P. C. Mahalnobis in 1928. However use of this technique for assessment of genetic diversity in plant breeding was first suggested by C.R. Rao. It is used for measuring genetic divergence in the germplasm collection.
Cluster analysis:
Genetic assessment of germplasm is commonly undertaken by plant breeders to understand genetic variation in the germplasm and to discover patterns of genetic diversity. Cluster analysis, unlike discriminant function analysis, groups genetically similar genotypes. Clustering can be done on a morphological or molecular basis (e.g., using DNA markers). Analysis of genetic diversity levels in germplasm helps plant breeders to make proper choices of parents to use in breeding programs.
Path analysis:
Path analysis is a technique for decomposing correlations into different pieces for the interpretation of effects. The procedure is closely related to multiple regression analysis. Path analysis allows the researcher to test theoretical propositions about cause and effect without manipulating variables.
Line × tester:
Line × tester analysis is one of the most powerful tools for predicting the general combining ability (GCA) of parents and selecting of suitable parents and crosses with high specific combining ability (SCA) (Rashid et al., 2007). Line × tester analysis provides information about combining ability effects of genotypes and also, knowledge regarding genetic mechanism controlling yield components. Information of general and specific combining abilities influencing yield and its components has become increasingly important to plant breeders to select appropriate parents for developing hybrid cultivars especially in cross pollinated crops. Many researchers have studied the combining abilities and gene actions of bread wheat hybrid populations by using line × tester analysis for some traits
Experimental Designs and their applications
| S. No. | Experimental Design | Condition of use |
| 1. | Completely randomized design | It is ideal when experimental material is limited and field is homogeneous. |
| 2. | Randomized block design | It is ideal when fertility variation of the field moves in one direction |
| 3. | Latin square design | It is ideal when fertility variation of the field moves in two directions |
| 4. | Split plot design | It is ideal when several factors are to be tested simultaneously out of which some require larger plots and other require smaller plots |
| 5. | Lattice design | It is ideal when the number of treatments are sufficiently large and form square |
| 6. | Augmented design | It is ideal to test number of germplasm lines in a limited area |
Application of biometrical techniques in crop improvement:
Assessment of variability:
The efficiency of selection largely depends upon the magnitude of variability present in the gene pool of a crop species is essential to start a judicious breeding programme. Earlier, variability used to be assessed by visual observation. Now biometrical methods are available for systemic assessment of genetic variability. Presently two important biometric techniques metroglyph analysis and D2 statistics are widely used for assessment of genetic variability in the breeding population. The techniques are known as an aid to assessment of variability.
Determination of yield Components:
Enhancement in economic yield is the prime objective in all plant breeding programs. But yield has low heritability and direct selection for yield is not sufficiently effective. In such situation, enhancement in yield is achieved through indirect selection of yield contributing characters. There are some biometrical techniques which are useful in determining yield components. Such techniques include correlation analysis path coefficient analysis and discriminate function analysis. These techniques are known as aids to determination of yield components.
Determination of gene action:
The knowledge of gene action involved in the expression of various polygenic characters is essential to a plant breeder. The knowledge of gene action is useful in deciding the plant breeding procedure for genetic improvement of various polygenic traits. The gene action of two type’s additive gene actions non additive gene action. When there is preponderance of additive gene action, mass selection and progeny selection would be rewarding. When there is preponderance of non-additive gene action, heterosis breeding is the right choice. There are several biometrical techniques which are used to study gene action in plant breeding population. The commonly used biometrical techniques include diallel cross, line * tester cross.
Assessment of varietal adaptation:
Adaptation refers to fitness of a genotype or population in a given environment or the process of adjustment of organism to the changes occurring in the environment. Assessment of varietal adaptation helps in identification of crop cultivars with stable performance in fluctuating environments. Thus, it is important for stabilization of crop production over region and seasons. There are four different models which are used for assessment of varietal adaptability. These are Finlay and Wilkinson model, Eberhart and Russell model.
Analysis of polygenic traits:
Biometric genetics provide solution to analysis of polygenic traits which is not possible through mendelian genetics.
Evaluation of breeding population:
Biometrical genetics provide ways and means for genetic evaluation of various breeding population in terms of variability, heritability combining ability, gene action, adaptation and yield attribute.
Scientific basis for results:
Biometrical genetics provides statistical bases for scientific interpretation of results in plant breeding research.
Conclusion:
The utility of biometric genetics in crop improvement exists from very earlier times. This article gives a practical knowledge about the utility of statistical technique in crop improvement. The statistical techniques those are used regularly in crop improvement programme summarized very well in the current article.
Reference:
- George (2007) Principles of Plant Genetics and Breeding, Blackwell Publishing Ltd
- Benjamin A and pierce (2012) genetics a conceptual approach, W. H. Freeman and Company New York
- Singh B. D. (1983) plant breeding principles and methods, kalyani publishers.
- Singh Phundan and Narayanan S S (2000) Biometrical techniques in plant breeding, kalyani publishers.
Authors:
Vikrant Khare1* and Puja Shrivastava2
*1Research Associate, Division of Nuclear Agriculture and Biotechnology, DAE-Bhabha Atomic Research Centre, Trombay, Mumbai, Maharashtra, India, Email id:
2Senior Plant Breeder, Department of Plant Breeding and Genetics, Punjab Agriculture University, Ludhiana, Punjab, India